This is an old revision of the document!
Adding CAD geometry to visualizations
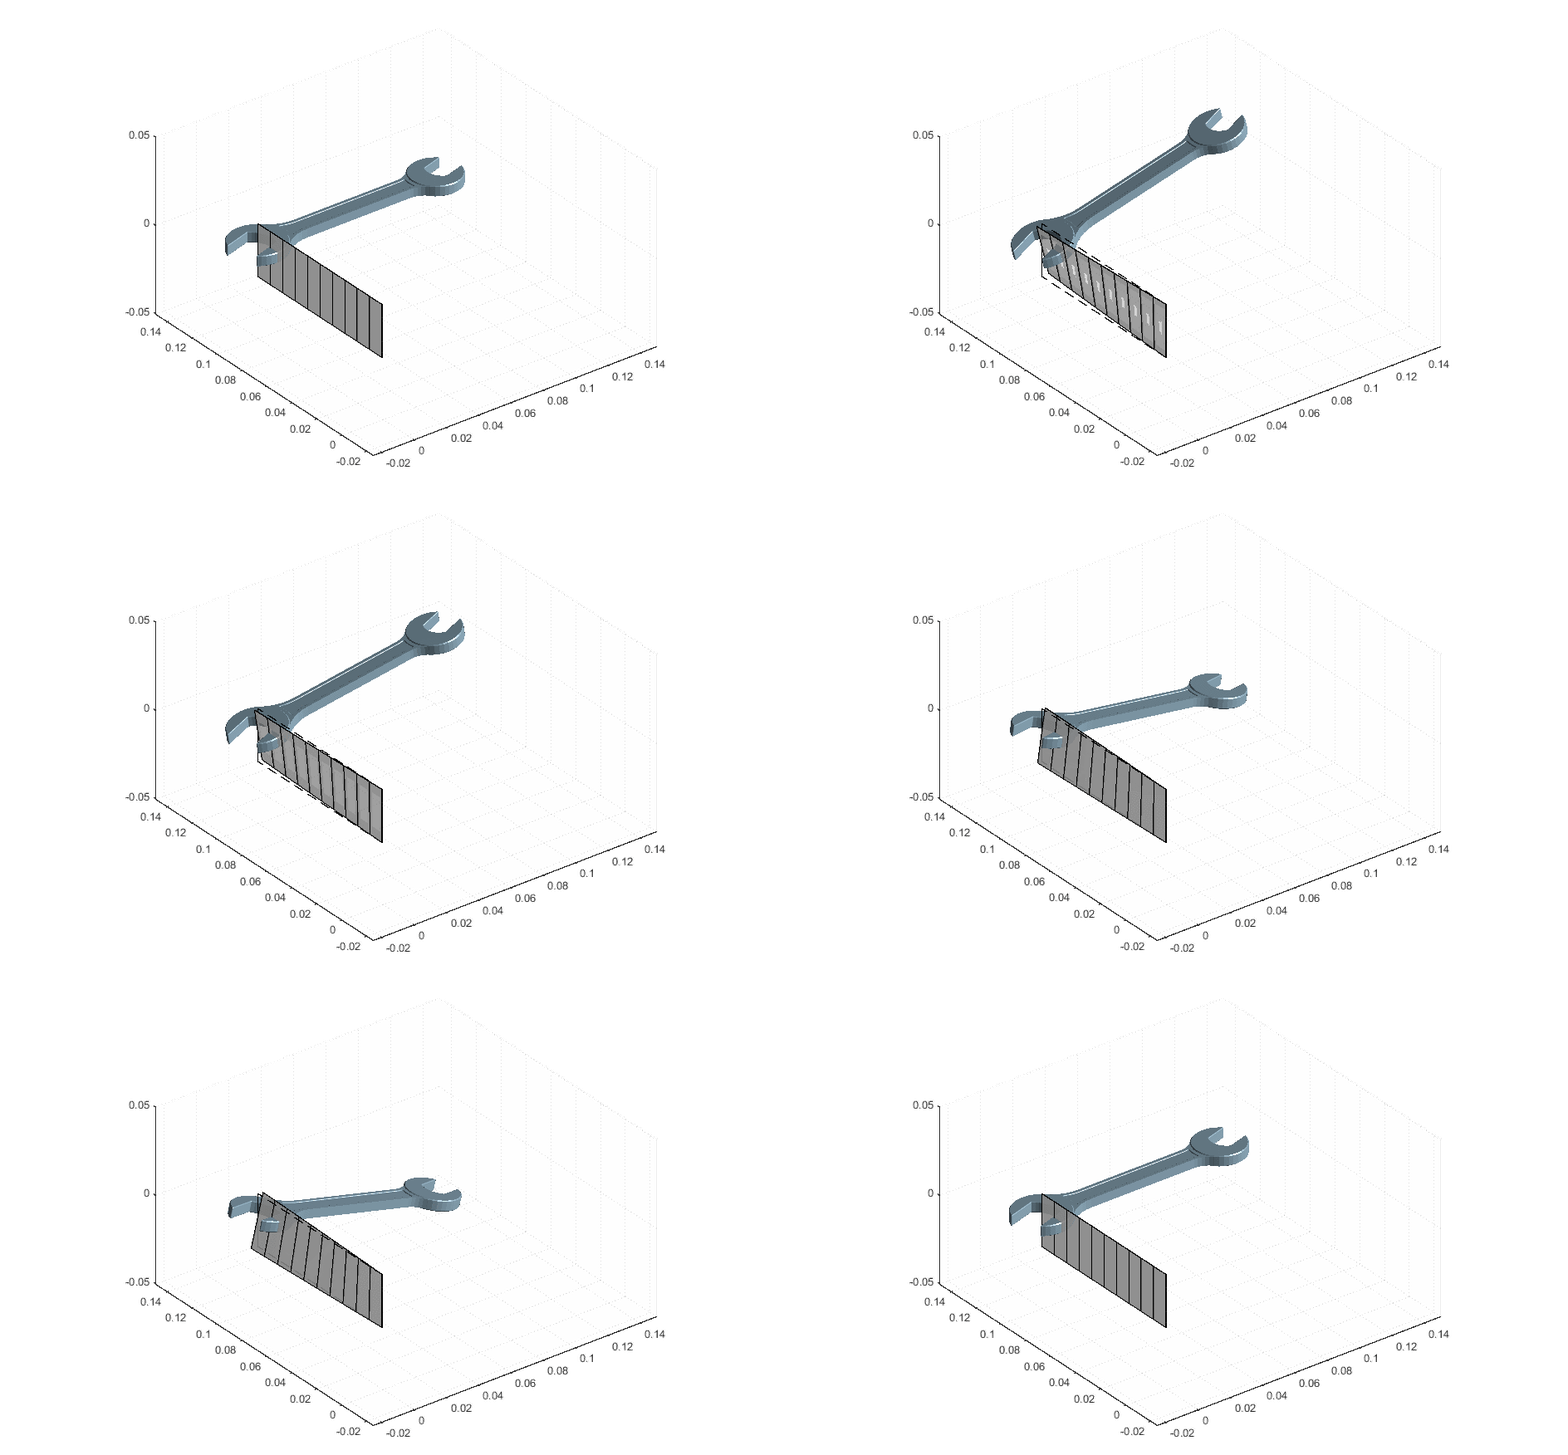
In order to generate nice visualizations and animations, CAD geometry can be added to Spavisual. At this page, an example is provided how CAD geometry can be added to the visualization by exploiting the USERPLOT function of spavisual.
First of all, the CAD geometry has to be saved in an .STL file. When saving the .STL file, it is important to save as ASCII with units in meters. In Solidworks, these settings can be set via 'save as ⇒ select .stl ⇒ options'. Furthermore, make sure you check the 'Do not translate STL output data to positive space' checkbox. Optionally, you can also provide an alternative coordinate system while saving the .STL file. In the visualization, the origin of the selected coordinate system is going to coincide with a spacar node.
For adding the .STL geometry to Spavisual in Spacarlight, the opt.customvis field is going to be used (available from version 1.26). This field will add extra lines in the visualization part of the .dat file (check the spavisual manual for all supported commands). In example, the USERPLOT function can be added with:
opt.customvis = {'USERPLOT ADDCAD'};
where “ADDCAD” is the name of a matlab function (saved in CAPITALS!) which is called in the visualization procedure. Furthermore, two extra lines will be added to alter the axis limits to match them with the CAD geometry:
opt.customvis = {'USERPLOT ADDCAD',...
                 'AXISPROPS',...
                 'LIMITS -0.025 0.15 -0.025 0.15 -0.05 0.05'};
Bellow, an example is provided for the ADDCAD function. In this example, the geometry is projected on translation node 5 and rotation node 6 (note the used node numbering correspond to the node numbering in the .dat file, which can deviate from the numbering in the Spacarlight input file). Furthermore, the string in Filename has to match with the filename of the .STL file.
Notes:
- the function stl2fv is used for converting .STL geometry to vertices and faces. This function can be found on mathworks and downloaded from http://www.mathworks.com/matlabcentral/fileexchange/3642
- the function quat2rotm is used to convert quaternions to a rotation matrix, which should be available in recent matlab versions. If not available, you will have to create this code yourself.
- Converting .STL data to vertices and faces can take a long time (the stl2fv function). To improve speed, the variables
FandVcan be saved (in example in a .mat file), and loaded from this file instead of calling the stl2fv function. - For good visualization, it is recommended to turn on 'Scene Light' in the matlab figure (View ⇒ Camera Toolbar ⇒ Toggle Scene Light). Alternatively, lights can be enabled through the
opt.customvisinput field.
- ADDCAD.m
function [ handles ] = ADDCAD(axis,handles)
% Mark Naves
% m.naves@utwente.nl
% 6-14-2017
%Just an example how to add cad data to spavisual
%
%In visualization part of dat-file: USERPLOT ADDCAD
%Function requires stl2fv.m
%
%Check correct stl settings before saving. in save as => select .stl =>
%options => output as ASCII, unit as meters

%%
x_node = 5; %position node to follow ()
r_node = 6; %rotation node follow
Color = [162 195 214]./255;
Filename = 'cadfile';

%remember cad data to improve speed
persistent V H

%time step
t = axis.anim.CurrentTimeStep; %time step for motion
v = axis.anim.CurrentVibrStep; %time step for vibrations

%spacar data
lnp = axis.spacar.lnp;
if  strcmp(axis.anim.CurrentField,'CurrentTimeStep') || strcmp(axis.anim.CurrentField,'CurrentLoadStep')
    x = axis.spacar.x(:,t);
else
    x = axis.anim.Modes.X(:,v);
end

%Position of the node
x_pos = x(lnp(x_node,1:3));
q_pos = x(lnp(r_node,1:4));
R = quat2rotm(q_pos');

%plot/update cad data
if strcmp(axis.handles.figure.Visible, 'off')
    [F,V] = stl2fv(Filename);
    H =patch('Faces', F, 'Vertices',  V*R'+repmat((x_pos)',size(V,1),1),'FaceColor' ,Color,'EdgeAlpha',0);
    H.FaceVertexCData = repmat(Color,size(V,1),1);
else
    H.Vertices = V*R'+repmat((x_pos)',size(V,1),1);
end
end
An example of the input file for spacarlight is provided bellow:
- example.m
% EXAMPLE SCRIPT FOR RUNNING SPACAR LIGHT
% This example simulates a simple cross flexure rotating due to an applied moment
clc
clear

%% NODE POSITIONS
%           x y z
nodes = [   0 0 0;              %node 1
            0 0.1 0;            %node 2
            0.055 0.1 0.003];  %node 3

%% ELEMENT CONNECTIVITY
%               p   q
elements = [    1   2;  %element 1
                2   3]; %element 2


%% NODE PROPERTIES
%node 1
nprops(1).fix                = true;         %Fix node 1
nprops(3).mass               = 0.074;        %0.74Kg at the center of mass
nprops(3).mominertia         = [ 0.00000398 0.00000252 0.0000000 0.00013376 0.00000000 0.00013739]; %Inertia at the center of mass


%% ELEMENT PROPERTIES
%Property set 1
eprops(1).elems    = 1;            %Add this set of properties to elements 1 and 3
eprops(1).emod     = 210e9;            %E-modulus [Pa]
eprops(1).smod     = 70e9;             %G-modulus [Pa]
eprops(1).dens     = 7800;             %Density [kg/m^3]
eprops(1).cshape   = 'rect';           %Rectangular cross-section
eprops(1).dim      = [30e-3 0.3e-3];   %Width: 50 mm, thickness: 0.2 mm
eprops(1).orien    = [0 0 1];          %Orientation of the cross-section as a vector pointing along "width-direction"
eprops(1).nbeams   = 1;                %4 beam elements for simulating these elements
eprops(1).flex     = 1:6;        	   %Model out-of-plane bending (modes 3 and 4) as flexible
eprops(1).color    = 'grey';
eprops(1).opacity  = 0.7;

%Property set 2
eprops(2).elems    = 2;                %Add this set of properties to element 2
eprops(2).orien    = [0 0 1];          %Orientation of the cross-section as a vector pointing along "width-direction"
eprops(2).hide     = true;           %Hide element (in visualization only)

%% SIMULATION
opt.customvis = {'USERPLOT ADDCAD',...
                 'AXISPROPS',...
                 'LIMITS -0.025 0.15 -0.025 0.15 -0.05 0.05'};

out = spacarlight(nodes, elements, nprops, eprops,opt);

